
After years of juggling multiple analytics tools, I'm now more focused on whether our product decisions move the needle on retention and revenue.
Because most product teams are making critical decisions with incomplete data.
You might have Mixpanel showing feature adoption, Google Analytics tracking traffic and Salesforce capturing customer interactions, but connecting user behavior to business outcomes feels impossible.
When behavioral data lives in silos, even the smartest teams struggle with questions like:
"Which onboarding flow produces the highest lifetime value customers?"
or
"Why do similar engagement patterns lead to completely different retention rates?"
This isn't just a reporting problem. It's actively limiting product-led growth.
If you're a product manager or data leader comparing analytics solutions or trying to justify upgrading your current tech stack, this guide shows why warehouse-native approaches outperform traditional point solutions.
What is product usage analytics?
Product usage analytics means collecting and analyzing data about how users interact with your digital product, going beyond surface metrics to understand behavioral patterns that predict business success.
This includes feature adoption sequences, user flow patterns, conversion moments, and drop-off points. Since this field continues evolving rapidly, you might encounter terms like behavioral analytics, product intelligence, or user analytics—all pointing to the same core idea: understanding user behavior to drive product decisions.
Here’s how product expert C. Todd Lombardo, author of Product Research Rules, put it during the Product Excellence Ask Me Anything webinar:
Qualitative research helps tell us why customers are using a product, and quantitative research helps tell us what they’re doing. The combination of those two things gives you a lot of power as a product manager.
The modern analytics challenge
Traditional analytics allow you to track surface metrics like page views and feature adoption, but they can't answer crucial questions about revenue impact or customer lifetime value without moving sensitive data out of your warehouses.
When behavioral insights live separately from customer context, you lose critical connections:
-
Data silos and incomplete attribution: Teams see higher retention from specific onboarding steps but can't identify which acquisition channels produce users most likely to complete them.
-
Security risks and misleading signals: Moving data across systems creates compliance challenges while declining feature usage appears before cancellation, missing that users contacted support multiple times first.
-
Resource waste and prioritization mistakes: Teams spend endless time building pipelines to connect insights, while low usage metrics hide that small user segments generate disproportionate revenue value.
-
Limited business metric access: The most important metrics including revenue, lifetime value, and churn indicators often can't be analyzed because that data never leaves the warehouse.
How does product usage differ from marketing analytics and BI
- Marketing analytics focuses on acquisition by measuring campaign effectiveness and conversion funnels. But tracking typically stops after initial conversion, missing the post-acquisition journey where product-led growth happens.
- Business intelligence centers on operational reporting using organization-wide data from CRM and finance systems. BI platforms excel at strategic insights but struggle with granular behavioral analysis.
- Product usage analytics bridges these gaps by focusing on post-acquisition behavior and connecting user actions to business outcomes like retention, expansion revenue, and customer lifetime value.
It is why smart teams are taking a warehouse-first approach, building composable data stacks that bridge previously siloed customer, product, and business data.
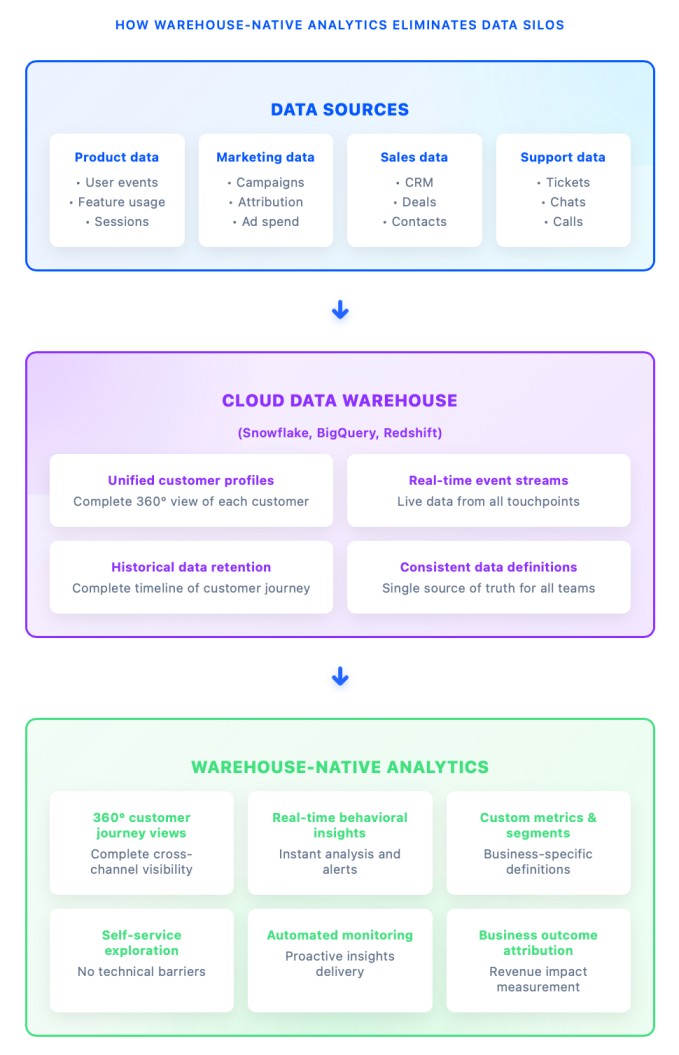 Image source: Optimizely
Benefits of product usage analytics
Product usage analytics deliver insights that empower product and user teams to strategically allocate resources, improve user experiences, and drive product growth.
Let’s look at the top four benefits in more depth.
1. Making confident data-driven decisions
Unified analytics eliminates guesswork by providing comprehensive insights that connect user behavior to business outcomes.
Rather than seeing Feature X has low adoption rates, you understand that customers who adopt Feature X show 40% higher lifetime value, generate 25% more expansion revenue, and primarily come through specific acquisition channels, enabling confident resource allocation based on measurable business impact.
2. Uncovering user frustrations and optimizing experiences
Behavioral analytics reveal friction points users might never report, but the real value comes from connecting insights to the broader customer context.
Consider usage data showing users abandoning a feature after the initial interaction. Analyzed in isolation, this suggests a UX problem. But combined with support data, you might discover these users find alternative workflows and become power users who drive expansion revenue.
3. Improving product stickiness and retention
Understanding which behaviors correlate with long-term engagement requires analyzing usage patterns alongside complete customer lifecycle data.
You might discover users engaging with three specific features within their first week show 60% higher six-month retention. With unified data, you also see which marketing channels and customer segments most likely complete this activation sequence.
4. Connecting product behavior to business outcomes
Unified platforms enable insights like: "Customers completing the enhanced onboarding flow show 25% higher expansion revenue within six months, with the strongest effect among enterprise customers acquired through direct sales."
Key product usage KPIs and metrics to track
Monitoring important product usage KPIs gives you a high-level sense of how well your product delivers value to users and helps you spot any issues. But you need to track the right ones and be able to connect quantitative data to the “why” behind the numbers.
While the specific metrics will vary based on your product and goals, here are some of the most important ones to track:
- Active users and engagement metrics: Daily, Weekly, and Monthly Active Users provide baseline indicators, but their value multiplies when viewed alongside customer characteristics and business performance. Track these by customer segment, acquisition channel, and tenure. Users acquired through content marketing might show lower initial DAU (Daily active users) but higher long-term engagement compared to paid acquisition.
- Feature adoption and usage patterns: Monitor adoption rates (percentage of users trying each feature) and engagement depth (usage frequency and combinations) to understand which capabilities deliver value. Analyze patterns by customer segment, company size, and use case to identify opportunities for targeted feature promotion or development prioritization.
- Conversion and activation metrics: Activation rates measure how effectively new users reach meaningful value milestones that correlate with retention. Define activation based on behaviors that predict long-term success, not just account setup. Time-to-value metrics show how quickly users achieve desired outcomes, directly correlating with satisfaction and retention likelihood.
- User paths and drop-off analysis: Flow analysis reveals how people navigate your product, highlighting common success paths and abandonment points. Cohort analysis tracks behavior changes over time, revealing engagement patterns that predict long-term success.
Pro tip:
Andrew Caplan, Head of Growth at Postscript, shared his experiences on the importance of tracking activation:
Agreeing on what a successfully ‘activated’ account looked like and understanding all the individual actions to get there allowed us to take our new user onboarding to the next level. The team is able to clearly prioritize ideas and projects since we all agree what success looks like. That activation metric is paying huge dividends to our users and our company.
Building an effective product usage analytics strategy
Even with the right metrics in place, maximizing the value of usage analytics requires an intentional approach.
Use the following three tips to make sure you can translate analytics into strategic, actionable insights.
1. Aligning analytics with business objectives
Map analytics strategy to specific goals:
-
Reducing churn: Focus on leading indicators of disengagement and behaviors correlating with retention.
-
Driving expansion: Track feature usage patterns predicting upsell opportunities.
-
Improving activation: Analyze onboarding flows correlating with long-term engagement.
-
Optimizing acquisition: Connect post-conversion behavior to acquisition sources, identifying channels producing the highest lifetime value customers.
2. Creating a modern, unified data stack
Cloud data warehouses like Snowflake, BigQuery, and Redshift collect first-party data from all touchpoints—product interactions, marketing campaigns, sales activities, and support conversations.
Warehouse-native analytics operate directly on unified data with capabilities ensuring performance at scale:
-
Smart sampling delivers quick results for ad-hoc explorations
-
Auto-materialization optimizes frequent query patterns
-
Specialized optimization handles millions of events efficiently
3. Democratizing data access
Self-service capabilities enable product managers, marketers, and customer success teams to explore data without depending on analysts for every query.
Process integration embeds analytics into roadmap planning, feature prioritization, and performance reviews.
As Brian Balfour, former VP of Growth at Hubspot, puts it:
As you gain fresh insight from your data, it opens the door to new questions.
The warehouse native advantage
Here's what I believe: "Companies need to bring analytics to where their data lives, not the other way around."
Warehouse-native analytics delivers five core advantages:
- Business outcome attribution: Test directly against metrics in your warehouse without complex pipelines.
- On-the-fly exploration: Generate cohort insights instantly, reducing the time from question to actionable insight.
- Cross-channel analysis: Analyze email campaigns, CRM metrics, and web behavior in one unified environment.
- Safety and compliance: Keep sensitive data in your warehouse without compromising innovation and governance.
- Data consistency: Eliminate platform discrepancies when everyone works from the same warehouse data.
Taking the next step
The ability to combine analytics with your consolidated customer data opens new possibilities for experimentation-led growth:
-
Run experiments using your complete customer data instead of fragmented metrics
-
Make decisions based on true business outcomes like revenue and lifetime value
-
Scale experimentation across products and features with unified measurement
-
Measure impact through controlled tests that matter to stakeholders
After all, the future belongs to teams that experiment against complete customer data and measure real business impact.

Entrepreneur, executive and product leader with a proven track record of conceiving and building innovative, successful, large-scale software systems Company builder...
- Last modified: 7/7/2025 4:49:06 AM